Reports & Statistics
2025 Student Body Statistics
Size
- 91 incoming students
Demographics
- 61% male, 39% female
- 65% US Citizens/PR, 35% international
- 13 countries, 3 continents
- Canada, China, Greece, India, Nepal, Pakistan, Singapore, South Korea, Spain, Taiwan, The Bahamas, the United Kingdom, and the United States
Academic Backgrounds
- 31% CS/Data Science/Statistics/ML/AI
- 31% Engineering
- 16% Business
- 13% Finance/Economics
- 9% Math/OR
- 3% Science/Medicine
- 4% Social Sciences/Policy
- 1% Languages
- 2% Other (Arts, Law, etc.)
Totaling more than 100% due to candidates in multiple categories.
Work Experience
- 0 years (≥1 internship): 50.5%
- 0 years (no internship): 4.4%
- 1-2 years: 18.7%
- 3-4 years: 14.3%
- 5-9 years: 7.7%
- 10-14 years: 2.2%
- No answer: 2.2%
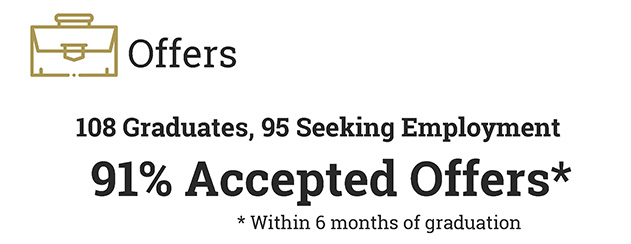
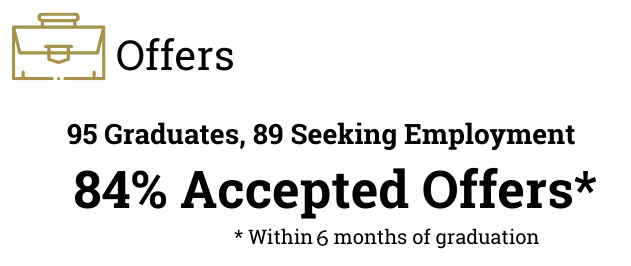
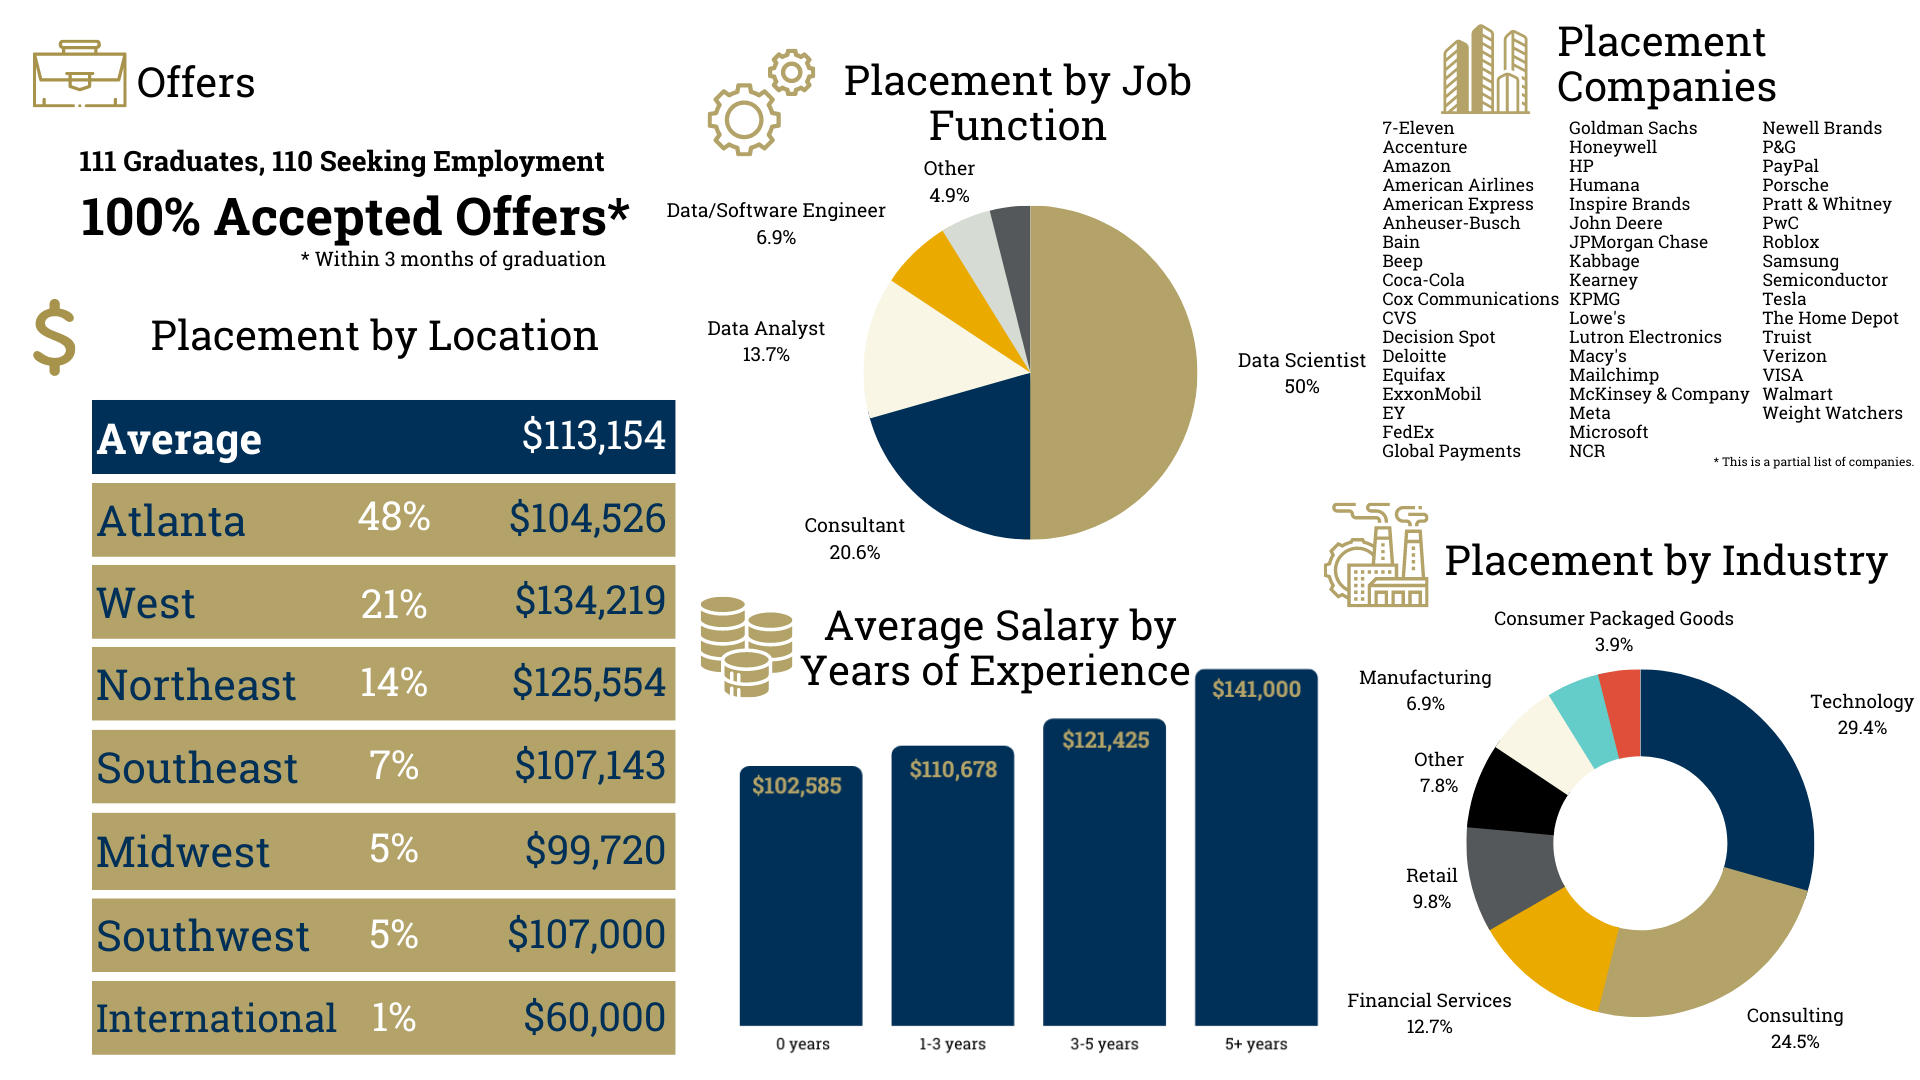
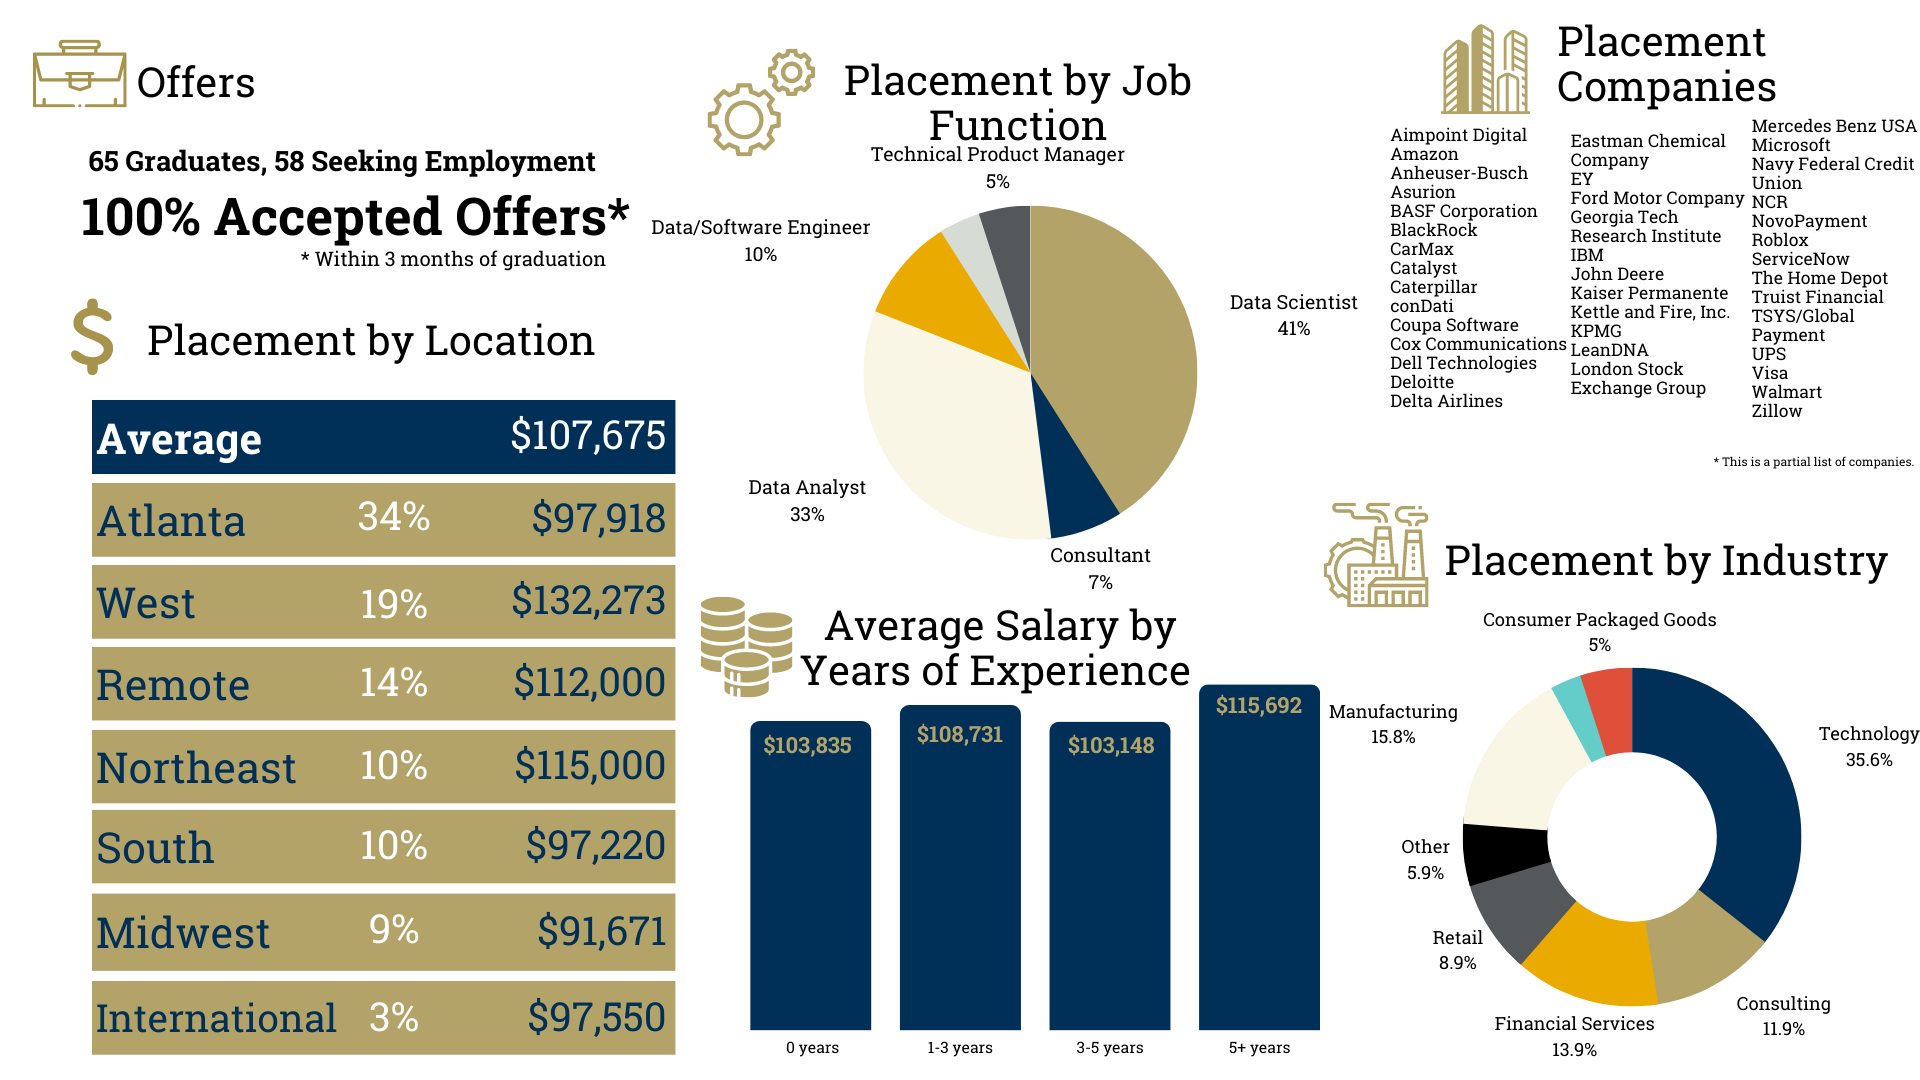
2024 Employment Statistics
Job-Seeking Graduates received full-time offers
Range in Base Salary
Average Base Salary
of placed students accepted jobs in the US
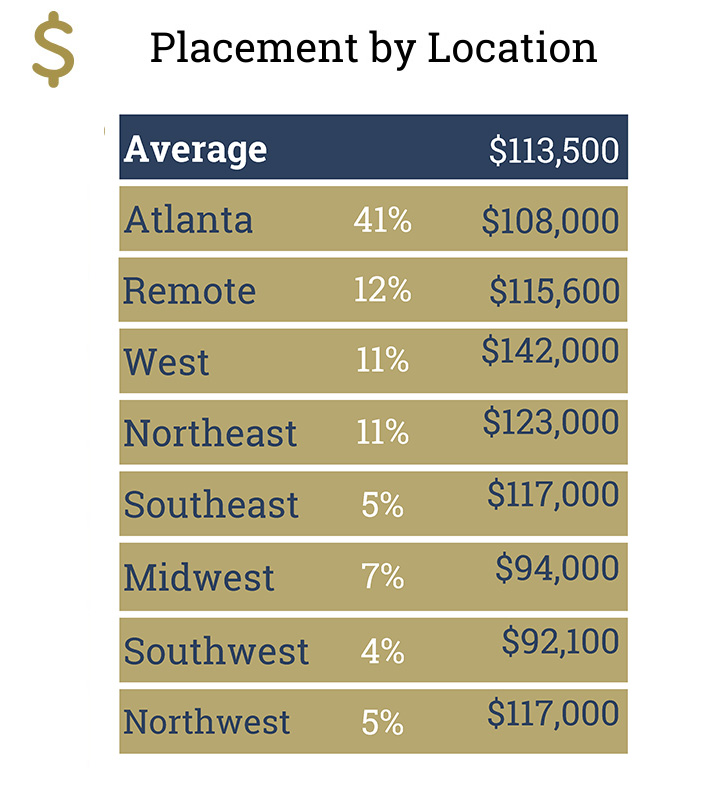
Placement by Location
| Location | Percentage of Graduates | Average Salary |
|---|---|---|
| Atlanta | 41% | $108,000 |
| REMOTE | 12% | $115,600 |
| West | 11% | $142,000 |
| Northeast | 11% | $123,000 |
| Southeast | 5% | $117,100 |
| Midwest | 7% | $94,000 |
| Southwest | 4% | $92,000 |
| Norththwest | 5% | $117,000 |
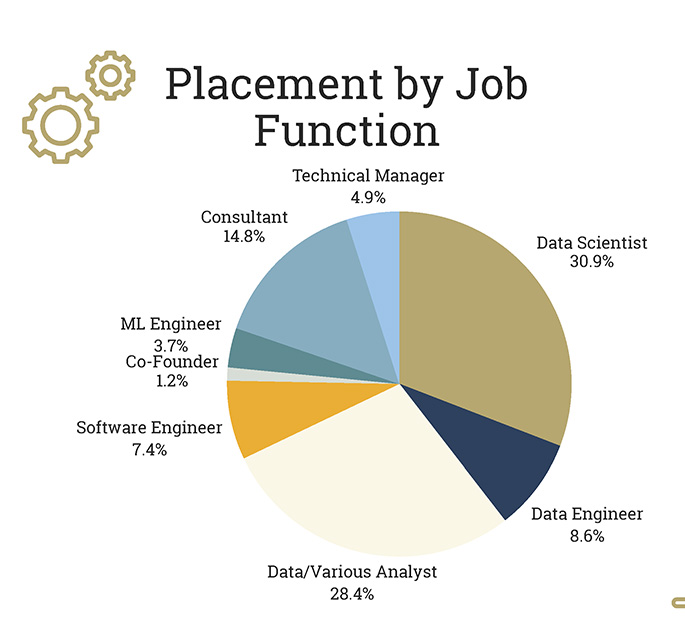
Placement by Job Function
| Job Function | Percentage of Placements |
|---|---|
| Data Scientist | 30.9% |
| Data/Various Analyst | 28.4% |
| Consultant | 14.8% |
| Data Engineer | 8.6% |
| Software Engineer | 7.4% |
| Technical Manager | 4.9% |
| ML Engineer | 3.7% |
| Co-founder | 1.2% |
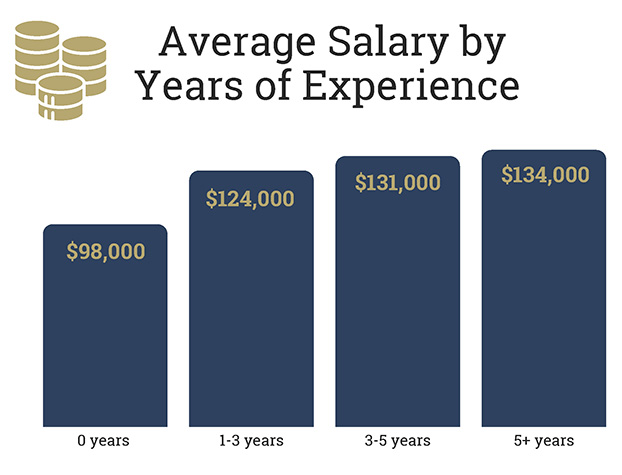
Average Salary by Years of Experience
| Years of Experience | Average Salary |
|---|---|
| 0 years | $98,000 |
| 1-3 years | $124,000 |
| 3-5 years | $131,000 |
| 5+ years | $134,000 |
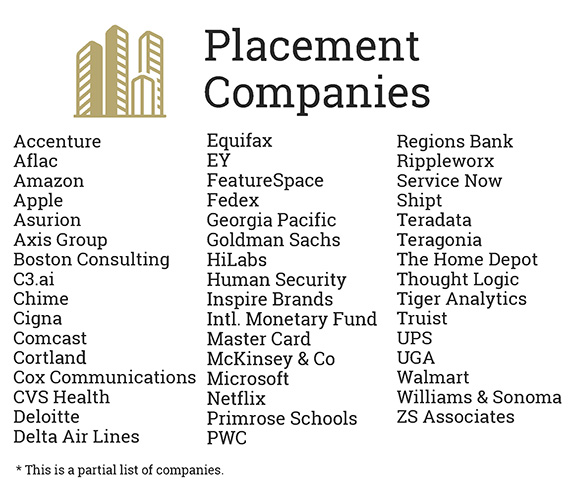
Placement Companies
| Company |
|---|
| Accenture |
| Aflac |
| Amazon |
| Apple |
| Asurion |
| Axis Group |
| Boston Consulting |
| C3.ai |
| Chime |
| Cigna |
| Comcast |
| Cortland |
| Cox Communications |
| CVS Health |
| Deloitte |
| Delta Air Lines |
| Equifax |
| EY |
| FeatureSpace |
| Fedex |
| Georgia Pacific |
| Goldman Sachs |
| HiLabs |
| Human Security |
| Inspire Brands |
| Intl. Monetary Fund |
| Master Card |
| McKinsey & Co |
| Microsoft |
| Netflix |
| Primrose Schools |
| PWC |
| Regions Bank |
| Rippleworx |
| Service Now |
| Shipt |
| Teradata |
| Teragonia |
| The Home Depot |
| Thought Logic |
| Tiger Analytics |
| Truist |
| UPS |
| UGA |
| Walmart |
| Williams & Sonoma |
| ZS Associates |
This is a partial list of companies.
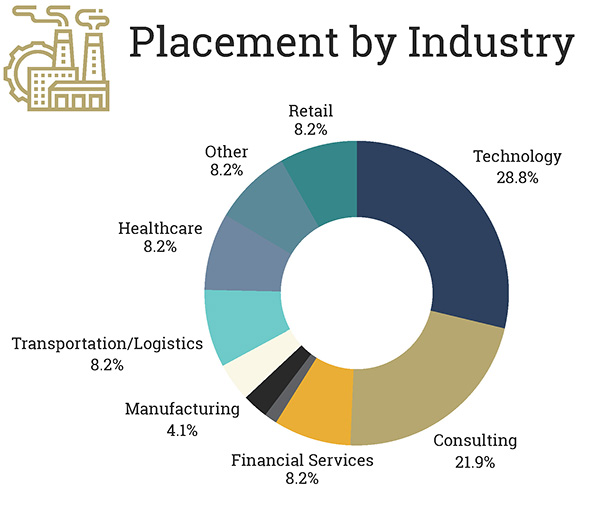
Placement by Industry
| Industry | Percentage of Placements |
|---|---|
| Technology | 28.8% |
| Consulting | 21.9% |
| Financial Services | 8.2% |
| Healthcare | 8.2% |
| Other | 8.2% |
| Retail | 8.2% |
| Transportation/Logistics | 8.2% |
| Manufacturing | 4.1% |
2024 Student Body Statistics
Size
- 94 incoming students
Demographics
- 58% male, 42% female
- 63% US Citizens/PR, 37% international
- 21 countries, 5 continents
- Belarus, Brazil, Canada, China, Hong Kong, Indonesia, India, Iran, Ireland, Israel, Lebanon, Nigeria, Pakistan, Poland, Singapore, South Korea, Spain, Thailand, Taiwan, United Kingdom, United States
Academic Backgrounds
- 40% CS/Data Science/Statistics/ML/AI
- 36% Engineering
- 24% Business
- 20% Finance/Economics
- 17% Math/OR
- 13% Science/Medicine
- 7% Social Sciences/Policy
- 5% Languages
- 3% Other (Arts, Law, etc.)
Totaling more than 100% due to candidates in multiple categories.
Work Experience
- Mean 2 years work experience
- 13% have a graduate degree
- 51% have experience, 49% do not
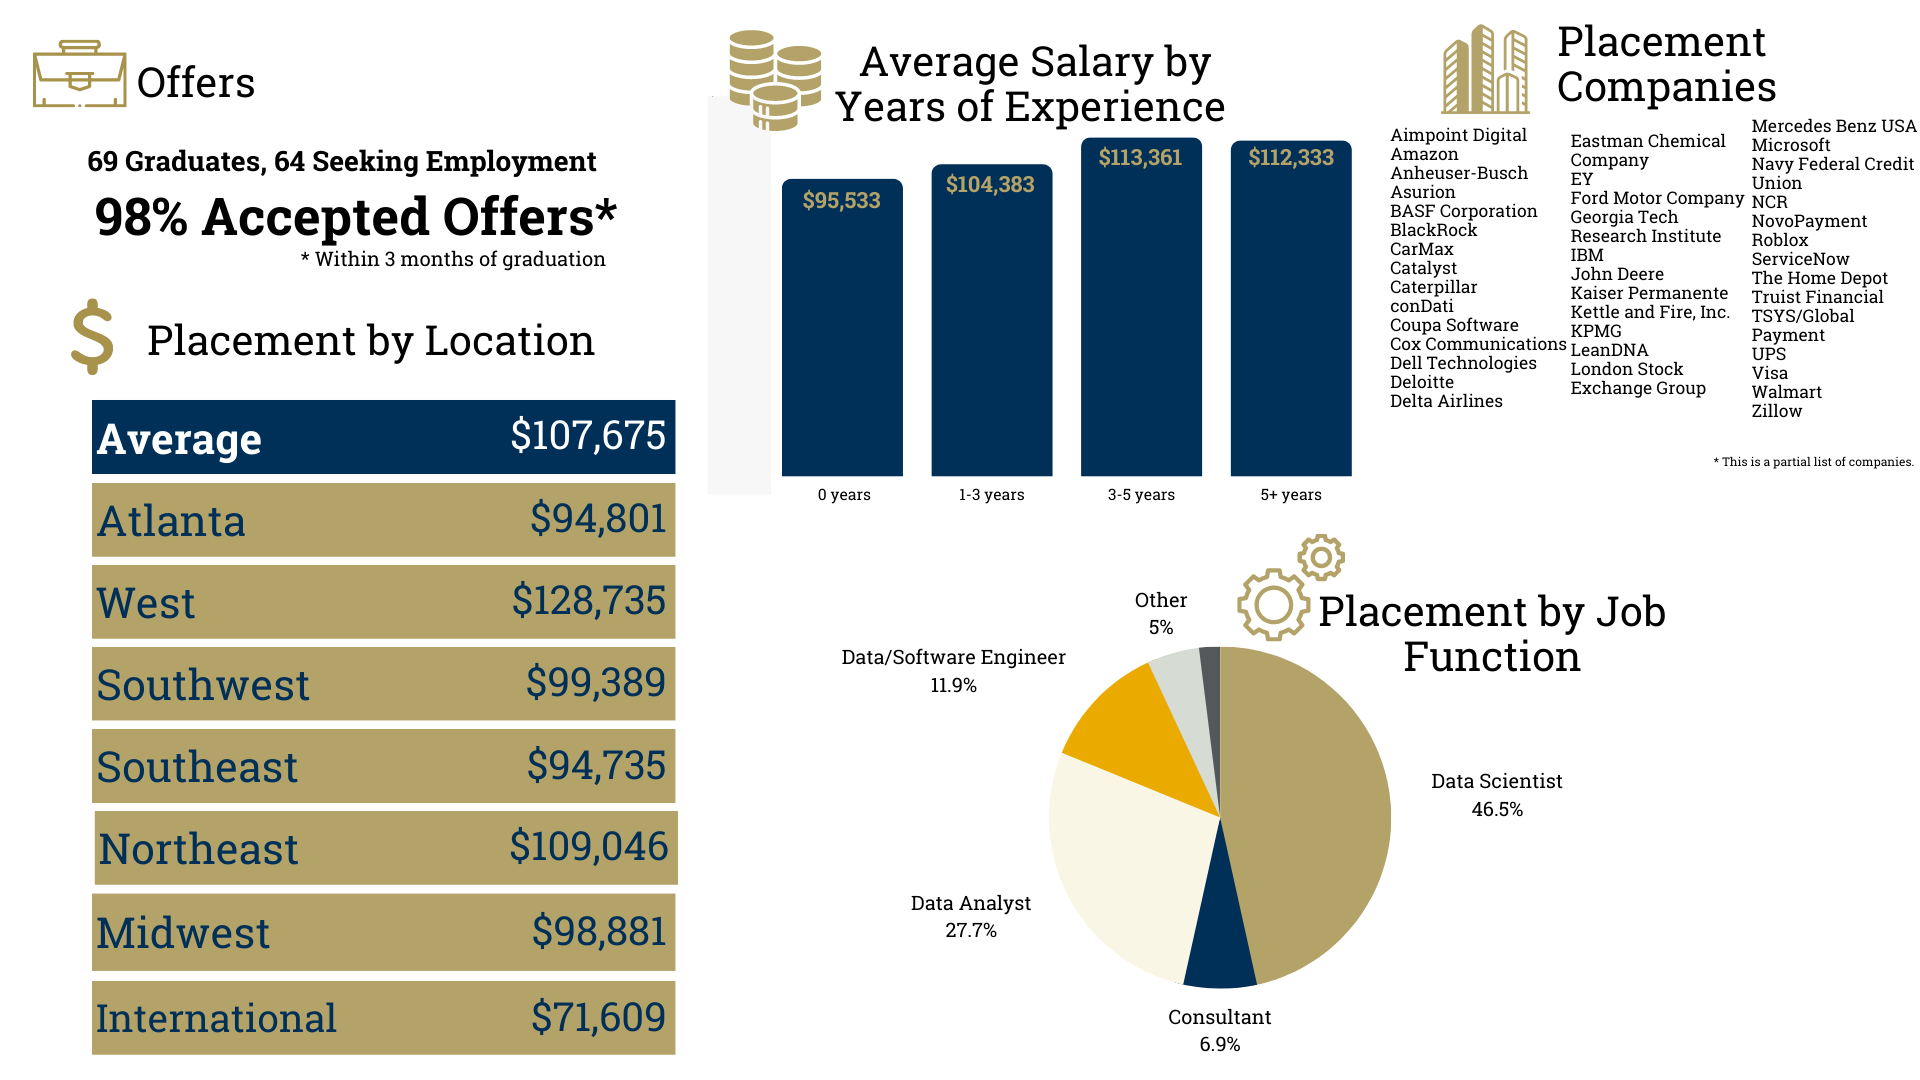
2023 Employment Statistics
Job-Seeking Graduates received full-time offers
Range in Base Salary
Average Base Salary
of placed students accepted jobs in the US

Placement by Location
| Location | Percentage of Graduates | Average Salary |
|---|---|---|
| Atlanta | 46% | $95,342 |
| West | 11% | $145,000 |
| Northeast | 15% | $132,000 |
| Southeast | 11% | $98,100 |
| Midwest | 8% | $96,000 |
| Southwest | 4% | $124,000 |
| International | 4% | $76,667 |
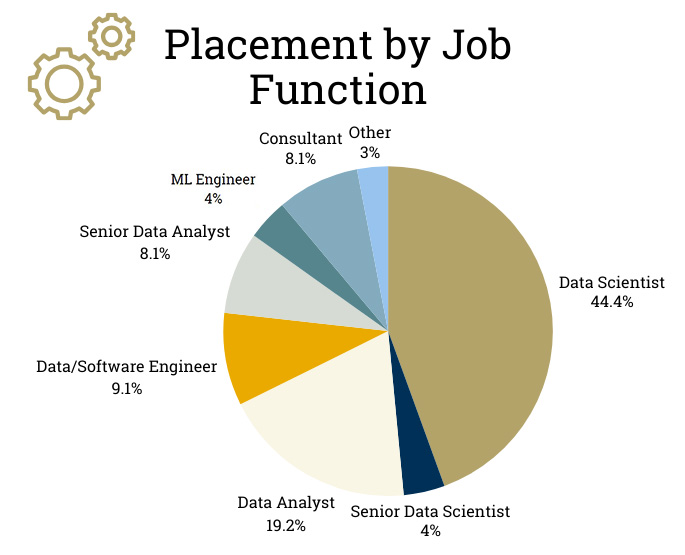
Placement by Job Function
| Job Function | Percentage of Placements |
|---|---|
| Data Scientist | 44.4% |
| Data Analyst | 19.2% |
| Data/Software Engineer | 9.1% |
| Senior Data Analyst | 8.1% |
| Consultant | 8.1% |
| Senior Data Scientist | 4% |
| Consultant | 25% |
| Data/Software Engineer | 10% |
| Other | 30% |
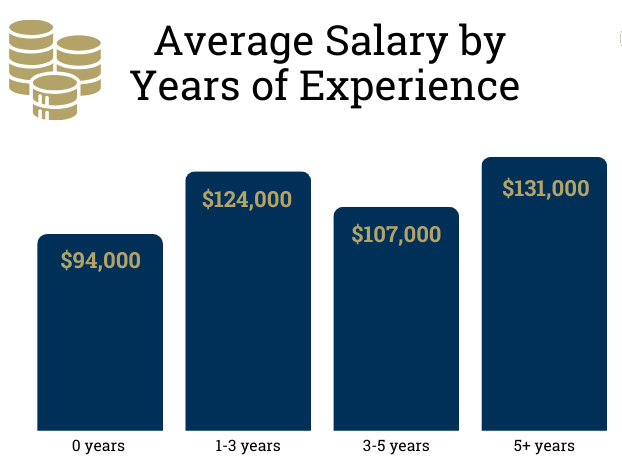
Average Salary by Years of Experience
| Years of Experience | Average Salary |
|---|---|
| 0 years | $94,000 |
| 1-3 years | $124,000 |
| 3-5 years | $107,000 |
| 5+ years | $131,000 |
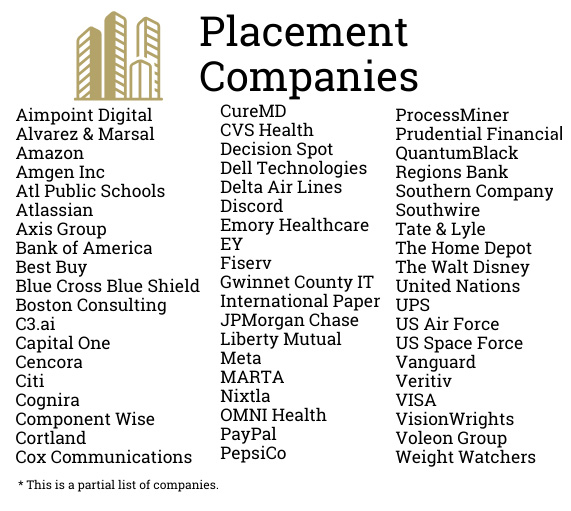
Placement Companies
| Company |
|---|
| Aimpoint Digital |
| Alvarez & Marsal |
| Amazon |
| Amgen Inc |
| Atl Public Schools |
| Atlassian |
| Axis Group |
| Bank of America |
| Best Buy |
| Blue Cross Blue Shield |
| Boston Consulting |
| C3.ai |
| Capital One |
| Cencora |
| Citi |
| Cognira |
| Component Wise |
| Cortland |
| Cox Communications |
| CureMD |
| CVS Health |
| Decision Spot |
| Dell Technologies |
| Delta Air Lines |
| Discord |
| Emory Healthcare |
| EY |
| Fiserv |
| Gwinnet County IT |
| International Paper |
| JPMorgan Chase |
| Liberty Mutual |
| Meta |
| MARTA |
| Nixtla |
| OMNI Health |
| PayPal |
| PepsiCo |
| ProcessMiner |
| Prudential Financial |
| QuantumBlack |
| Regions Bank |
| Southern Company |
| Southwire |
| Tate & Lyle |
| The Home Depot |
| The Walt Disney |
| United Nations |
| UPS |
| US Air Force |
| US Space Force |
| Vanguard |
| Veritiv |
| VISA |
| VisionWrights |
| Voleon Group |
| Weight Watchers |
This is a partial list of companies.
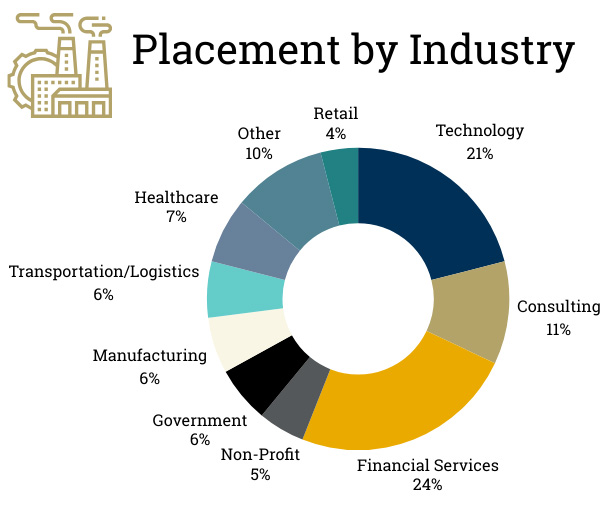
Placement by Industry
| Industry | Percentage of Placements |
|---|---|
| Financial Services | 24% |
| Technology | 21% |
| Consulting | 11% |
| Other | 10% |
| Healthcare | 7% |
| Government | 6% |
| Manufacturing | 6% |
| Transportation/Logistics | 6% |
| Non-Profit | 5% |
| Retail | 4% |
2023 Student Body Statistics
Size
- 101 students
Demographics
- 61 male (60%) and 40 female (40%)
- 55 US Citizens/PR (54%), 46 international (46%)
Academic Backgrounds
- 42% Engineering
- 24% Math/Statistics/OR
- 22% Computer Science
- 20% Business
- 18% Economics
- 11% Science/Medicine
- 10% Data Science/Analytics
- 6% Policy/Law/Government
- 6% Social Sciences/Religion
- 5% Languages
- 1% Fine/Performing Arts
Totaling more than 100% due to candidates in multiple categories.
Work Experience
- Mean 2 years work experience
- 56 have work experience (55%)
- 45 with no experience (except co-op/internship) (45%)
Academic History
- 17% have Master's/PhD
2022 Employment Statistics
Job-Seeking Graduates received full-time offers
Range in Base Salary
Average Base Salary
of job seeking MSA 2022s accepted offers in the US
2022 Student Body Statistics
Size
- 112 students
Demographics
- 76 male (68%) and 36 female (32%)
- 52 US Citizens/PR (46%), 60 international (54%) - from 19 non-US countries
Academic Backgrounds
- 49% Engineering
- 46% Business/Economics/Finance
- 33% Math/Statistics/OR/Data Science/Analytics
- 15% Computer Science
- 8% Social Sciences
- 5% Science
- 3% Public Health/Policy
- 3% Education
- 3% Languages/Communication
Totaling more than 100% due to candidates in multiple categories.
Work Experience
- Median = 1.5 years
- 60 have work experience
- 52 with no work experience (except co-op/internship)
Academic History
- 16 already have MS, MA, MBA or PhD
2021 Employment Statistics
Job-Seeking Graduates received full-time offers
Range in Base Salary
Average Base Salary
Job-Seeking MSA 2021s accepted offers in the US
Accepted offers were data science functions
2021 Student Body Statistics
Size
- 116 students
Demographics
- 88 male (75%) and 28 female (25%)
- 57 US Citizens/PR (49%), 59 international (51%) - from 25 non-US countries
Academic Backgrounds
- 39% Engineering
- 38% Business/Economics/Finance
- 31% Math/Statistics/OR
- 13% Computer Science
- 9% Social Sciences
- 5% Science
- 3% Arts
- 3% Languages/Writing
- 2% Professional (Law, Medicine, Pharmacy, etc.)
- 1% Other
Totaling more than 100% due to candidates in multiple categories.
Work Experience
- Median = 1.5 years
- 70 have work experience
- 46 with no work experience (except co-op/internship)
Academic History
- 20 already have MS, MA, MBA or PhD
2020 Employment Statistics
2020 Student Body Statistics
Size
- 74 students
Demographics
- 51 male (69%) and 23 female (31%)
- 42 US Citizens/PR (57%), 32 international (43%)
Academic Backgrounds
- 33% Engineering
- 20% Business/Economics/Finance
- 13% Computer Science
- 11% Math/Statistics/OR
- 8% Social Sciences
- 5% Languages
- 4% Physical Sciences
- 4% Public Policy/International Affairs
- 1% Fine and Performing Arts
Totaling more than 100% due to candidates in multiple categories.
Work Experience
- Median = 1 years
- 38(51%) have work experience
- 36 (49%) no work experience (except co-op/internship)
Academic History
- 27 already have MS, MA, MBA or PhD